REGION OF INTEREST STUDY USING THE VP8 IMAGE ANALYZER:
ISOMETRIC PROJECTION (3D) AND LEVEL SLICING FUNCTIONS
FOR DR. PETRUS SOONS
BY DEACON Pete Schumacher
@ 2010 ALL RIGHTS RESERVED, SCHUMACHER AND SOONS
The VP8 Image Analyzer performs two major, separate functions. One function is to make XYZ plots of image brightness on an oscilloscope-like monitor. The other function is to present false-color representations of selected brightness ranges (spans of brightness) on a color video monitor.
The XYZ plot of image brightness, referred to as an “Isometric Display” shows a relief map of image brightness variations. Normally, brightness has nothing to do with height or depth. The VP8 plots are simply graphic representations of changes in image brightness over an entire image. The image is viewed through a video camera. The camera is connected to the input of the VP8. The VP8 is an analog computer. The processor creates the display in real time. The process is “hard wired” so the VP8 can only “perform” the process. It cannot alter the image, edit portions of the image, or “recall, store, or remember” the image, and it cannot store the display or the results of the VP8 process.
It is important to note that the VP8 display of 3D in reference to the Shroud of Turin image is not “perfect” in that there are distortions caused by the weave of the cloth, by water stains and other stains on the Shroud, and by some of the other unique characteristics of the Shroud image, including its X-ray like properties.
The Level Slice process is used to create color-assigned references to selectable ranges in brightness within an image. There are eight adjustable brightness level range settings. A color is assigned to each range, or “band of brightness”. While viewing the image being processed, each color band is adjusted to highlight areas of the image, or objects within the image which have a common brightness. This is a very simple, basic means for classification of objects within images. Accuracy of object classification relies heavily on the image quality and type, and the characteristic brightness and contrast of objects imaged. For example: A range of brightness can be selected to include objects brighter than 250 but darker than 391, on a scale of 000 to 1500, wherein 000 is the darkest possible brightness (black) within the image and 1500 is the brightest possible brightness (white) within the image.
All objects or image areas falling in the range of 250 to 391 could be selected for display in the color green. All other display of brightness bands could either be turned “off” completely (black or grey or white, but not of any color), or “on” at some intensity of display color, for the color assigned to each other band. Thus, a range in brightness of 250 to 391 within an image of a farming area might represent the wheat crops, as opposed to other crops within the area imaged. When considering the Shroud of Turin image, the level slices might represent different features on the Shroud, such as blood stains, burn marks, scourge marks, or such features as may exist on the Shroud.
Of particular interest to Dr. Soons, is the area just below the chin area in the frontal image. Using brightness mapping, it is apparent that there is some basic shift in brightness across the image in this area of the Shroud. Further analysis suggests there might be some type of object at that location on the Shroud. Level slicing suggests there is an object at this location on the Shroud image too. With the Level Slice function the detail of this area can be examined more closely in terms of “inclusion” or “exclusion” from the various brightness groupings and colors assigned to them.
This basic classification of the image in this area of the Shroud produces results suggesting there is some object, or objects, at the location of interest (region of interest, ROI) defined by Dr. Soons. Level Slice studies further suggest the probability of some detailed patterns within the object within the ROI. Further analysis of the spectral characteristics over the ROI could yield further classification and grouping of patterns for “inclusion” or “exclusion” from these basic classifications, and should be performed before making conclusions concerning any potential objects or pattern details within the ROI. The VP8 is not capable of performing color-based-analysis of an image, short of using monochrome spectral filters in conjunction with the camera to isolate different color spectra.
While some tests were performed using broadband primary color filters, no significant variation in Level Slicing was noticed. Tests should be performed using very narrow band spectral filters, or other means of isolating spectral values within the ROI in order to sharpen the classification of the analysis.
CONCLUSIONS:
Using minimal classification image processing techniques involving isometric projection and Level Slicing functions of the VP8 Image Analyzer we were able to assess the region of interest ROI defined by Dr. Soons. It is apparent that some object, having some pattern detail within that object, resides within the defined ROI.
See the photos D, E, F and G: these are 4 photos from a complete series with results from the Level Slicing function, showing clearly the outline of a solid object under the beard in the neck area.

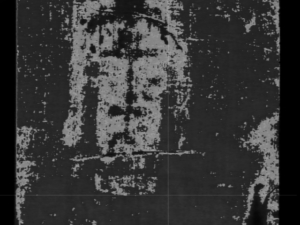
Photo D Photo E
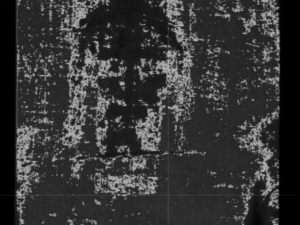
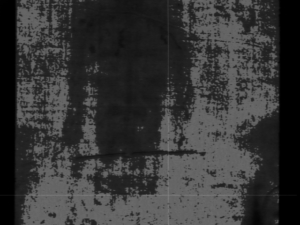
Photo F Photo G
4 photos from a series with results from Level Slicing function, and that clearly show the outline of some solid object with relief on the surface
Tests were performed over a period of seven days, using a backlit, full-size color transparency (Barrie Schwortz @ 1978). Tests were performed at the Shroud Exhibit And Museum, Inc, facilities in Alamogordo, New Mexico. Ambient lighting was tightly controlled, and uniform illumination of the scene was verified prior to the analysis and following the analysis. A Cohu Electronics Division camera model 4910 series CCD monochrome instrumentation camera setup for photometric analysis was used. The camera field flatness and uniform response to brightness were verified before and after the study. The VP8 Image Analyzer was used to perform these camera property verifications.
Photo 2: shows the fascimil of the Shroud (Barrie Schwortz) used for the research
Photo 10: Pete Schumacher working with VP8 Image Analyzer
Photo 11: Set-up for the research with controlled lighting
Photo 12: Schumacher in front of fascimil with research set-up
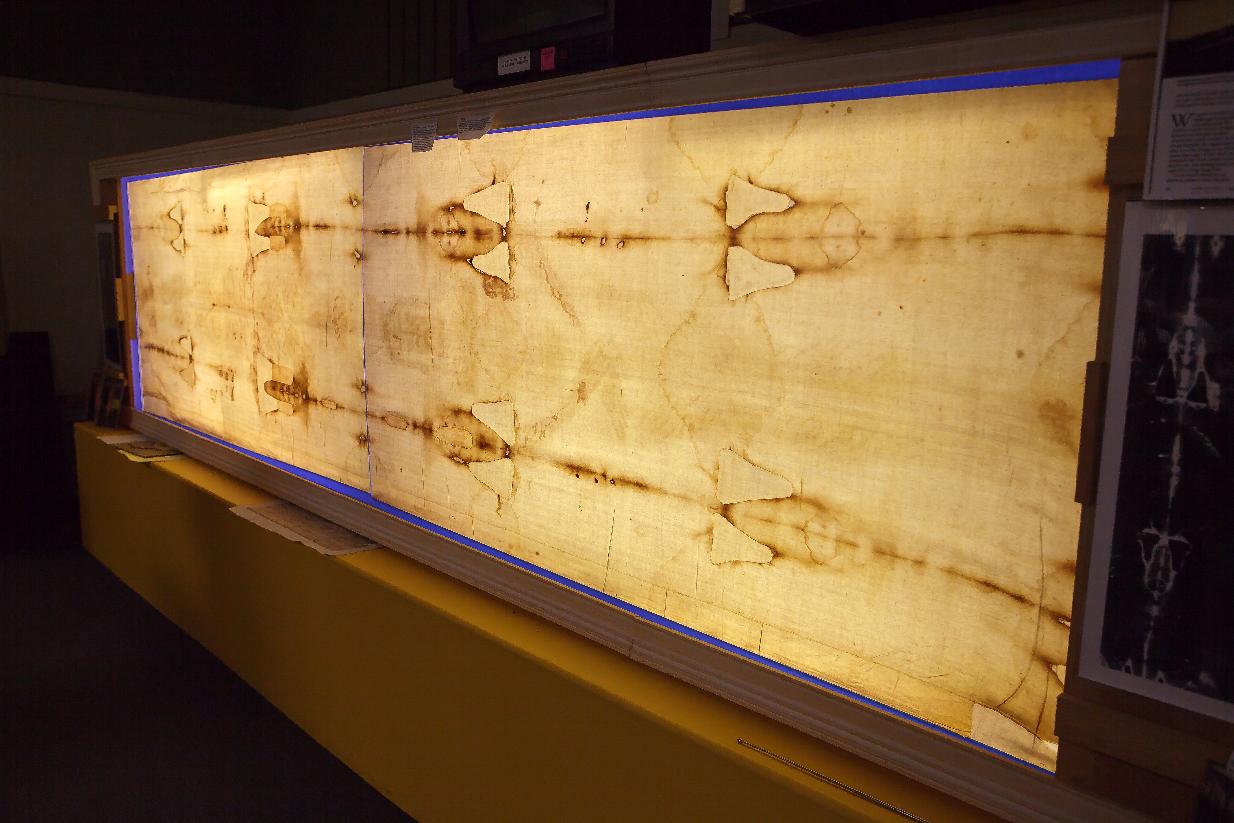
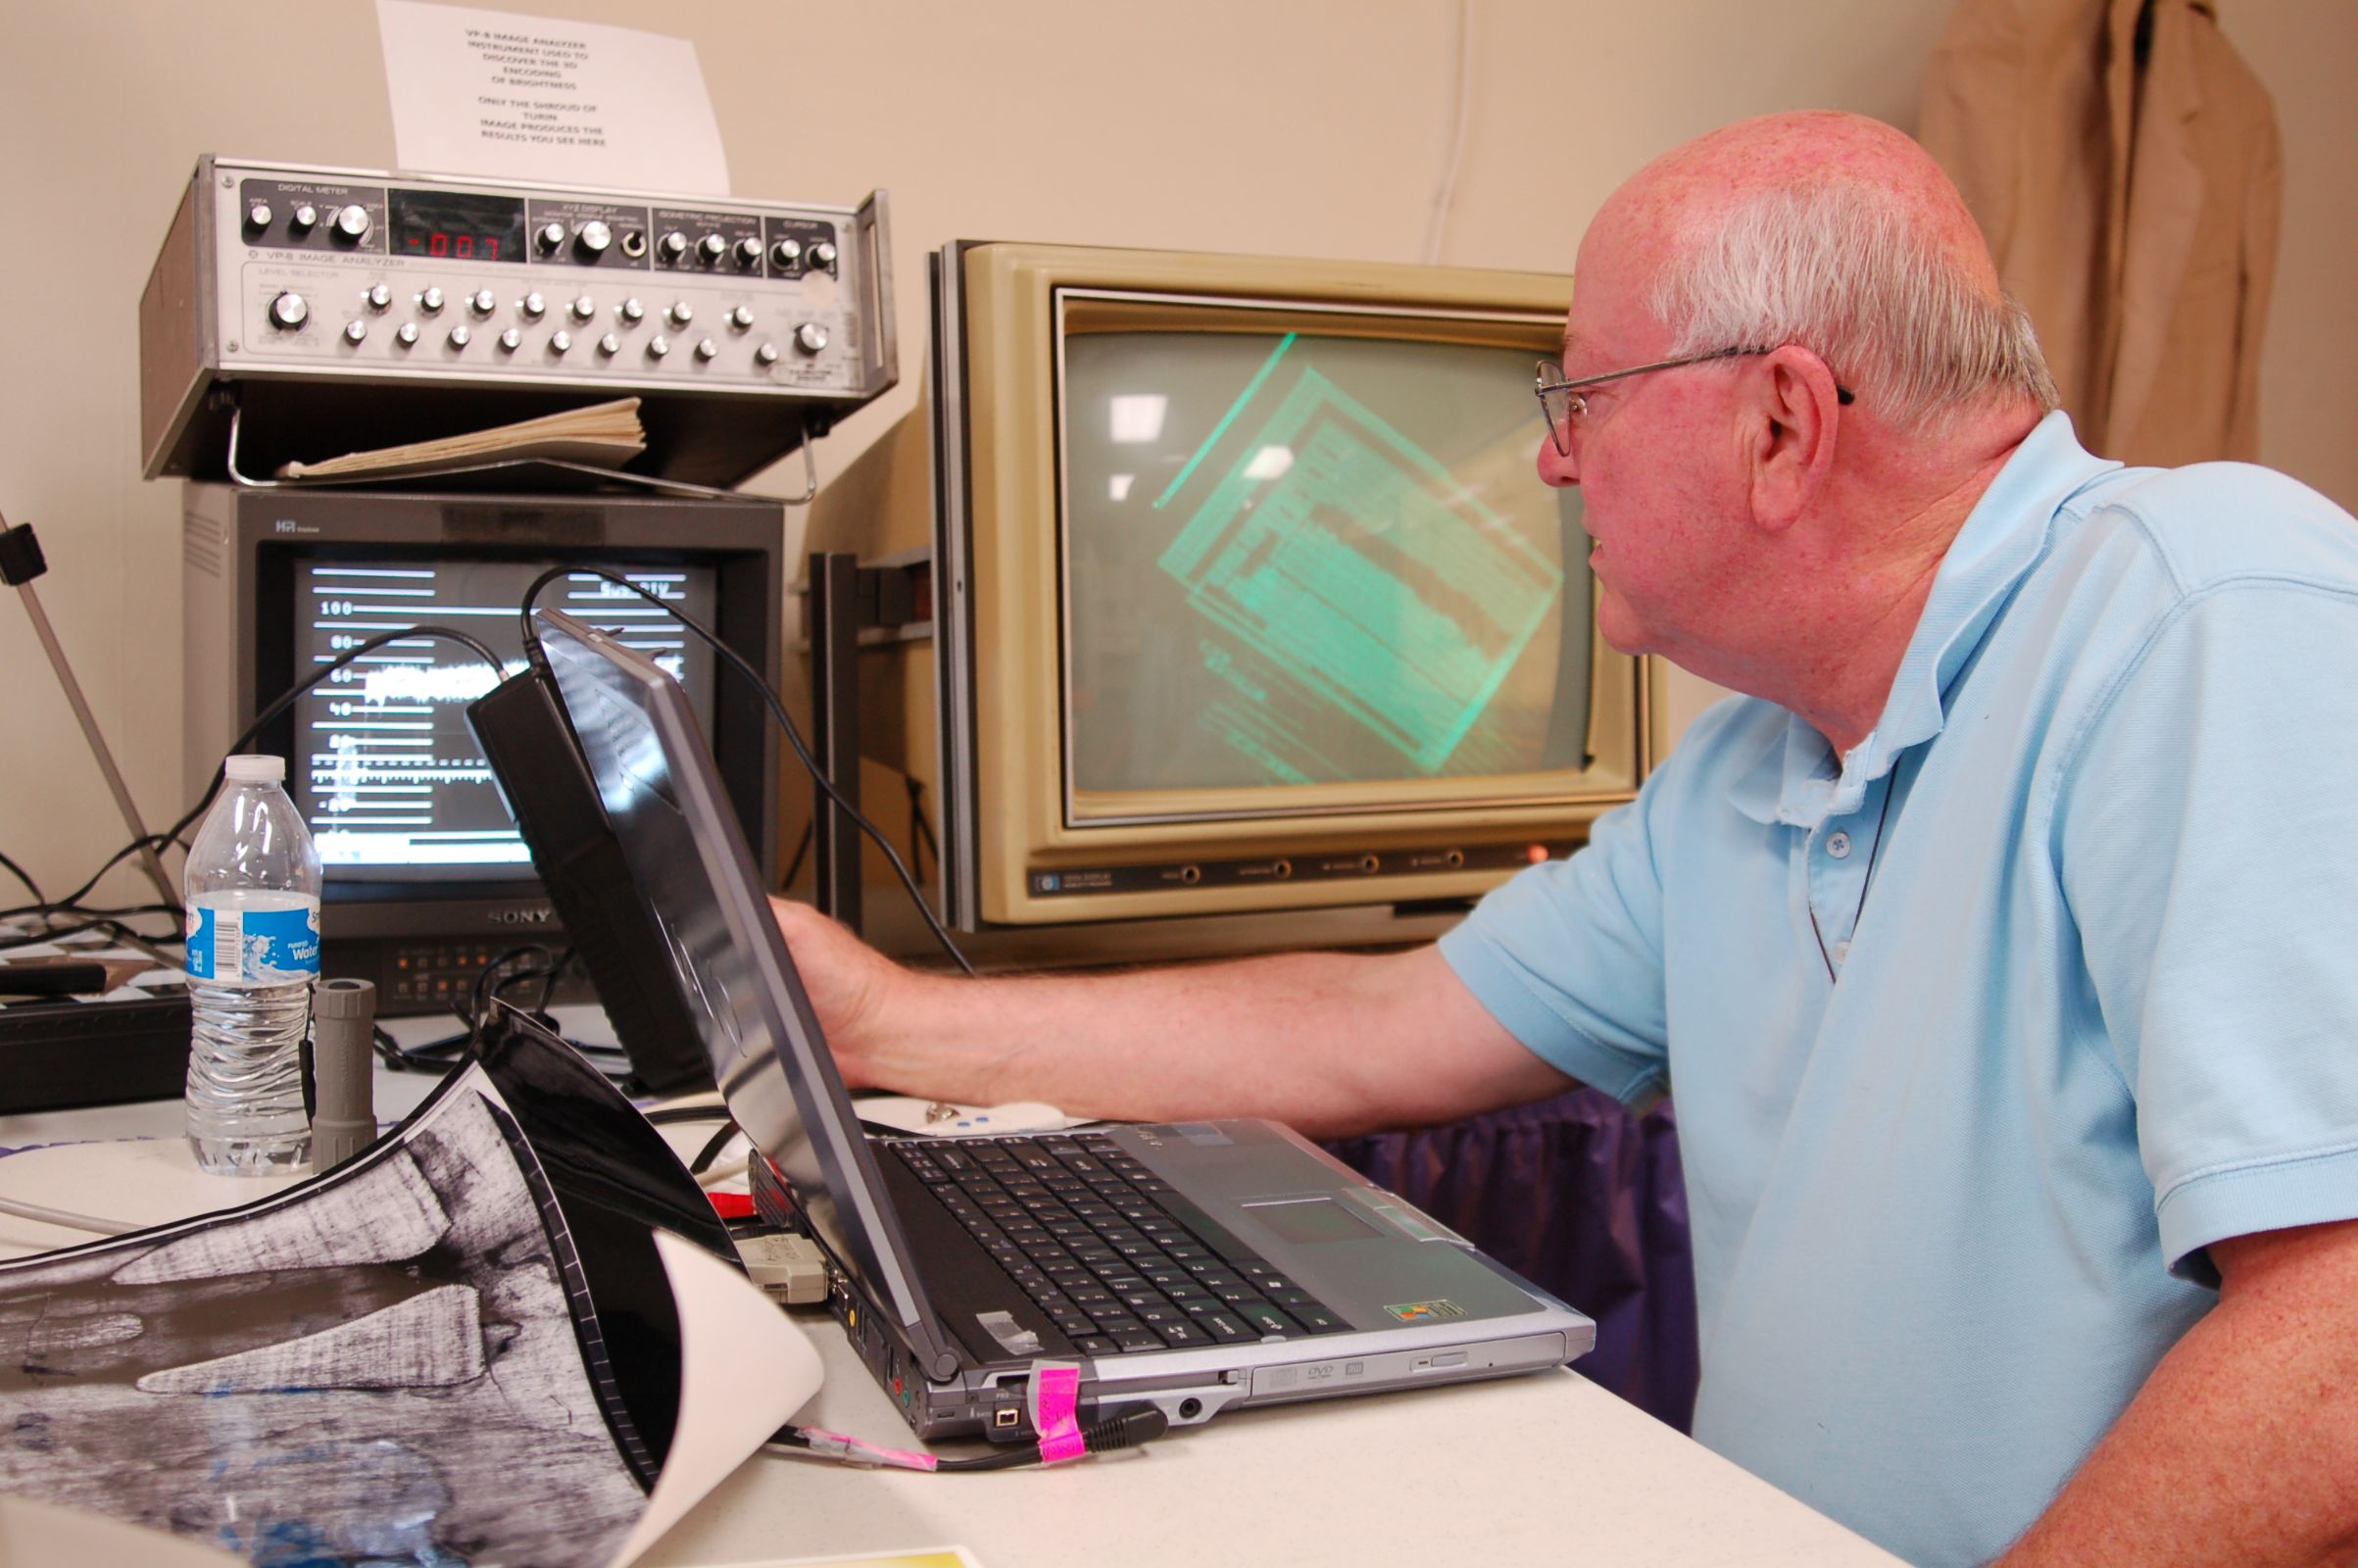
Photo 2 Photo 10
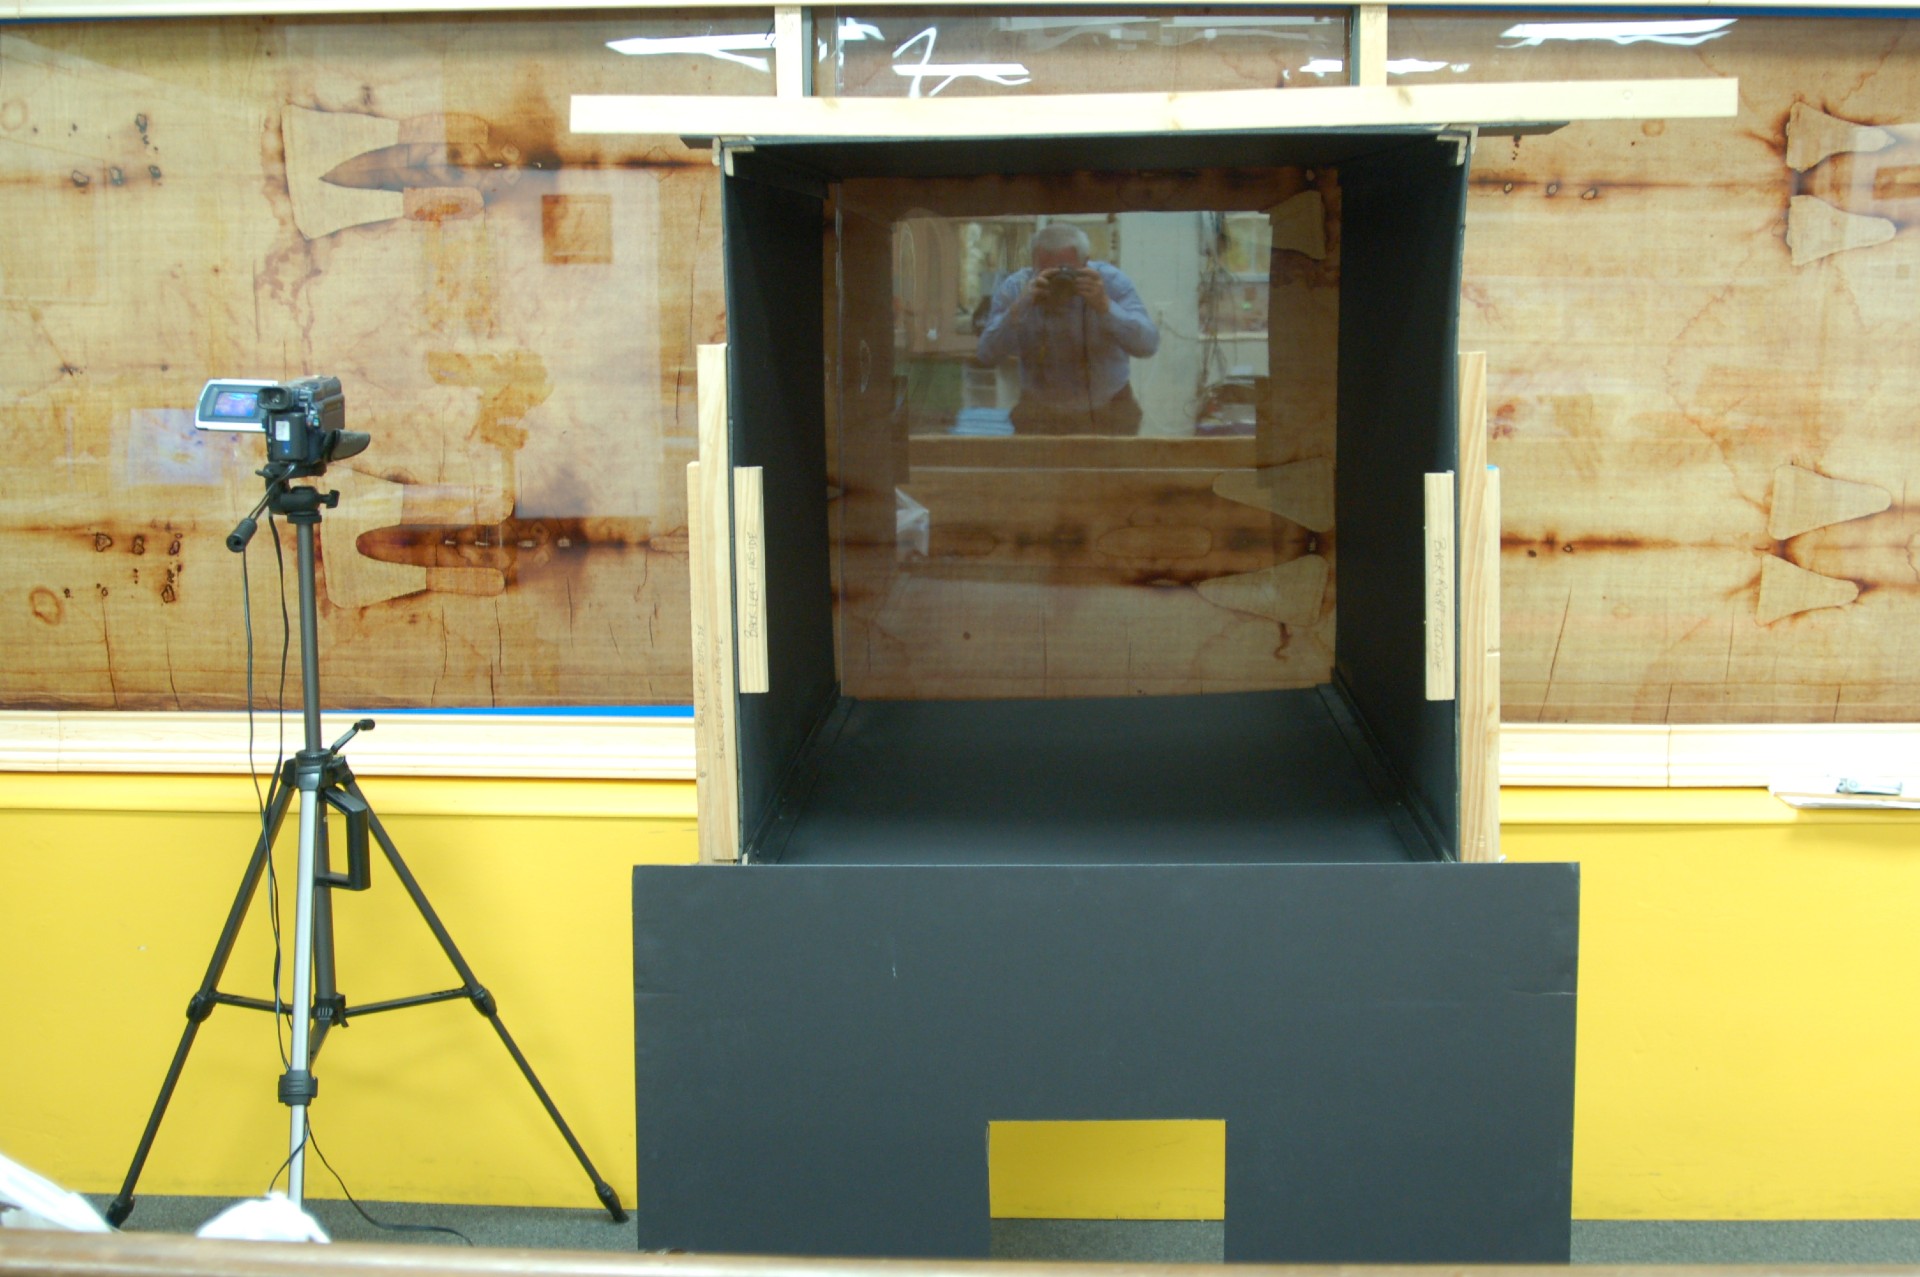
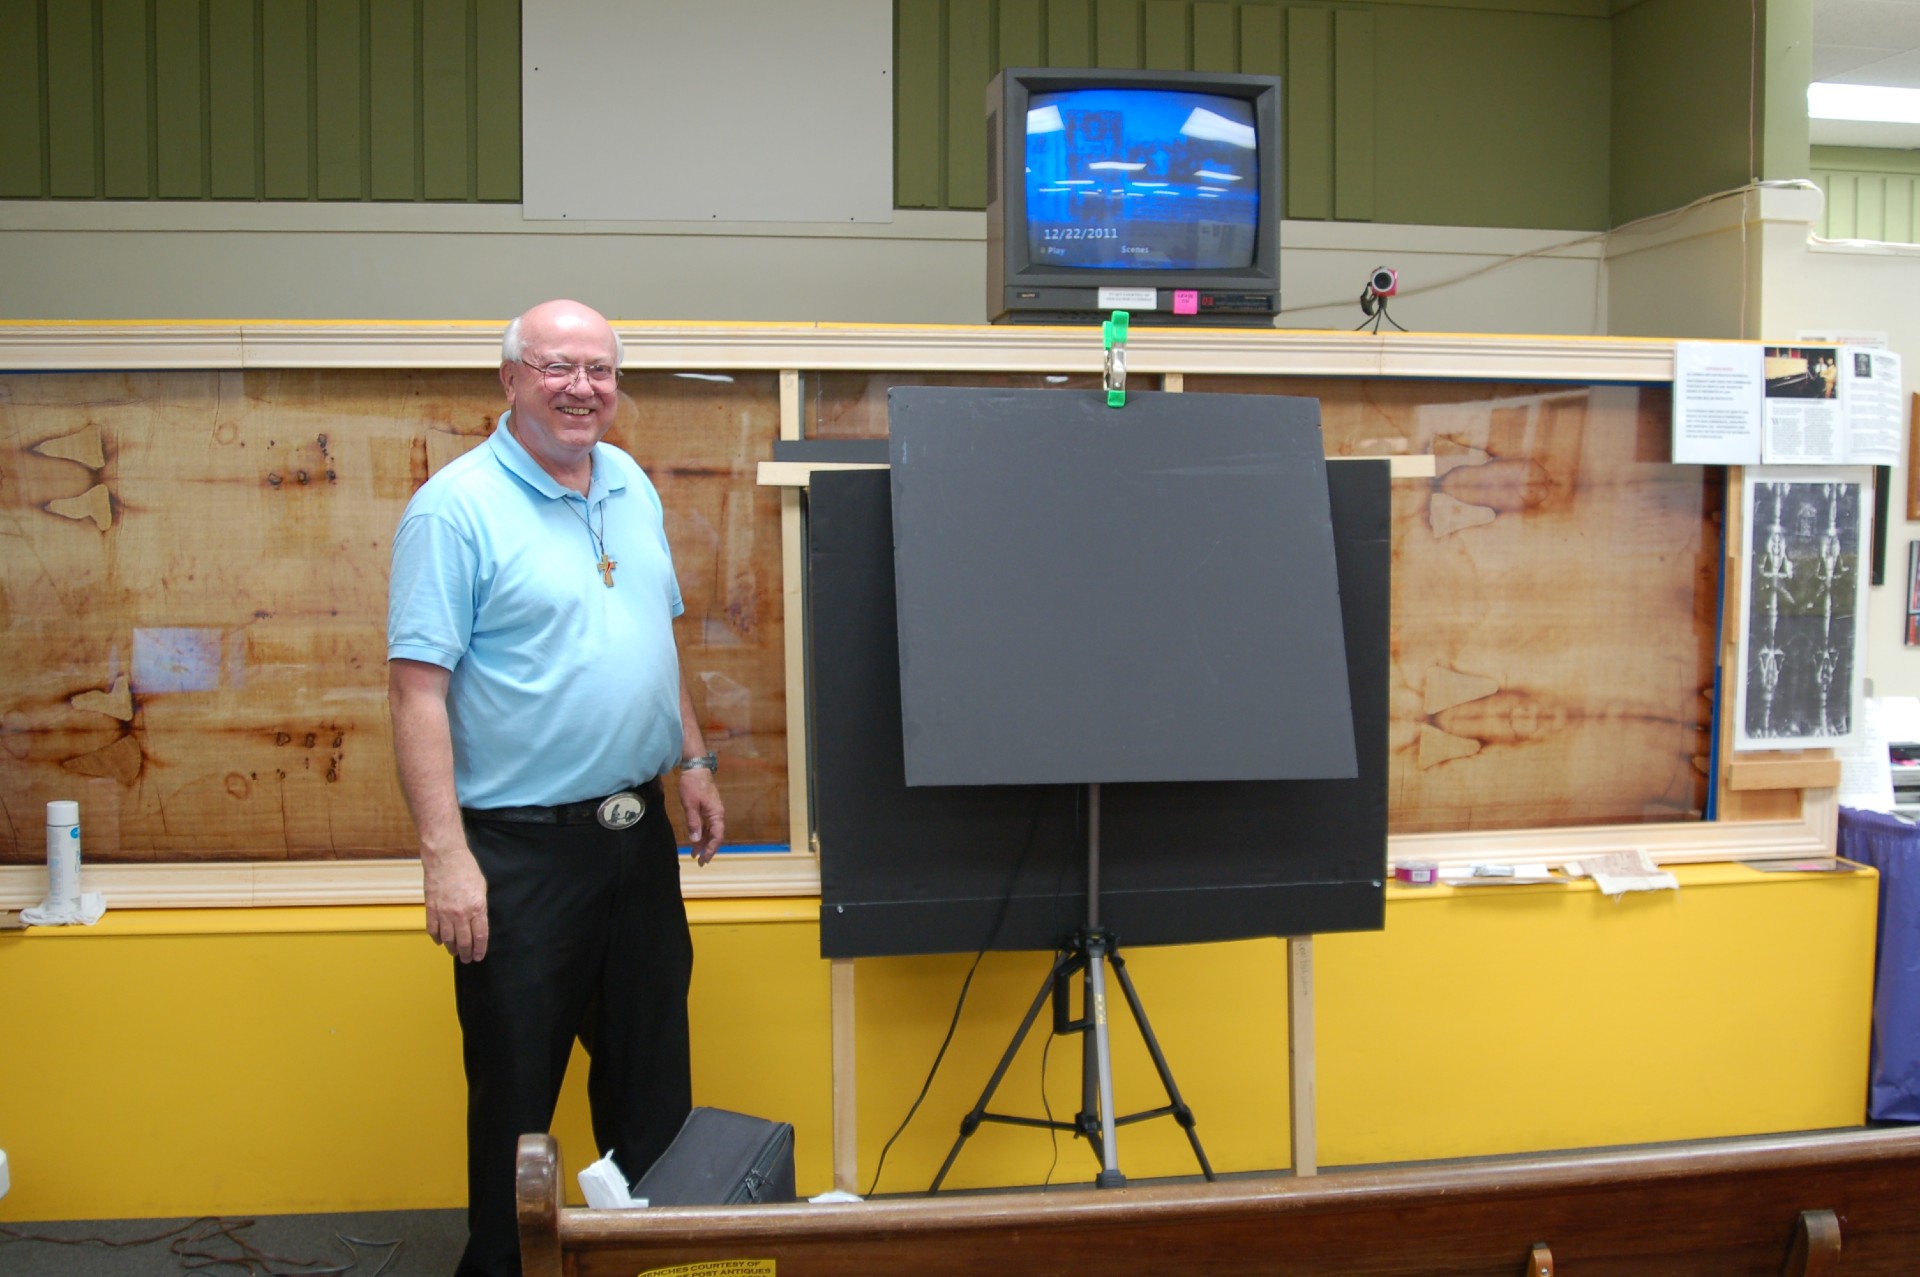
Photo 11 Photo 12
Schumacher could not define or recognize the object located within the ROI and he could not identify the object or any of the patterning within the object either as viewed directly or as enhanced through the processes of the VP8 Image Analyzer employed.
He was, however, able to confirm the presence of the image outline of an object within the ROI.
Following are two DVD’s with the results of the research:
1) 6.3.3. called; PETE SEAM VP8 Color Slice for Petrus
ROI SOLID OBJECT
Shows image in the VP8 Image Analyzer with under the beard a well visible outline of the Solid Object.
6.3.3 PETE SEAM VP8 Color Slice for Petrus ROI SOLID OBJECT
2) 6.3.4. called: PETE DVD VP8 SEAM 3D SOLID OBJECT rotation June 2010 VP8
This DVD shows the Level Slicing functions of the research. The face is on the left side in a horizontal position and the solid object in the middle of the screen, clearly visible.
6.3.4 PETE DVD VP8 SEAM 3D SOLID OBJECT rotation june 2010 VP 8